XY Scatter Plot Maker
Enter the graph title and terms to make a graph using XY Scatter Plot Maker
XY Scatter Plot Maker
XY Scatter Plot Maker is an online tool that helps to find the graph of a line in exponential, linear, and polynomial curves.
What is the “x” and “y” axis?
The x-axis and y-axis are the two perpendicular lines on the coordinate plane that intersect at the origin (0, 0). The x-axis is the horizontal line of the graph while the y-axis is the vertical line of the graph. These axes provide a reference for plotting the coordinate points and help to determine the position of each point on the graph, and this position is represented by a bullet point.
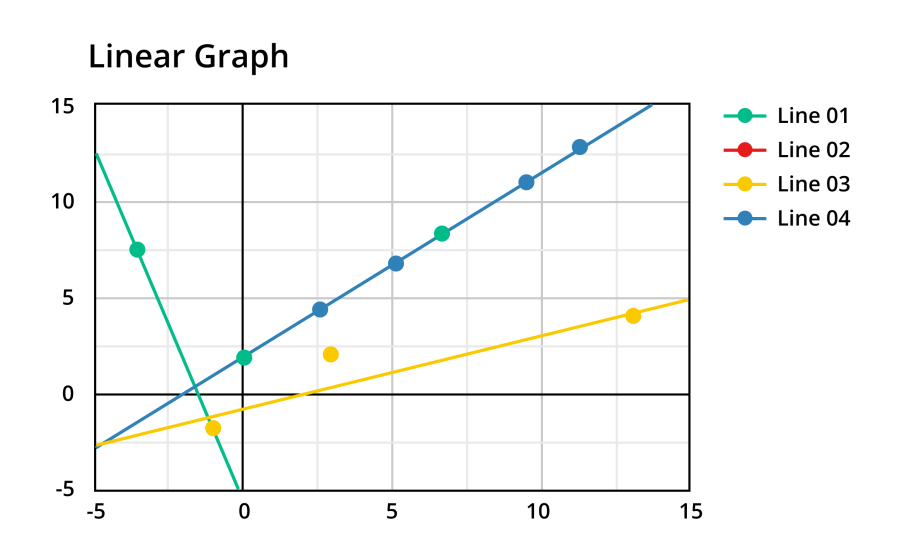
What is the linear graph?
A linear graph shows a linear relationship between point values of the x-axis or y-axis and draws a linear line on the graph. It consists of a set of coordinate points plotted on a two-dimensional plane with an x-axis and a y-axis. The linear graph is scattered below.
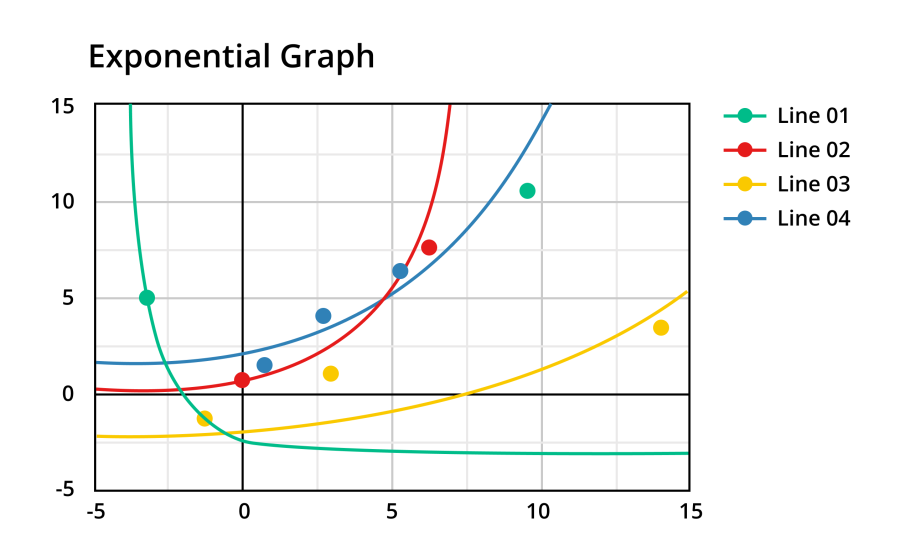
What is an Exponential Graph?
An exponential graph shows an exponential relationship between two variables. It is created by plotting a set of coordinate points on a two-dimensional plane typically with an x-axis and a y-axis. Connecting the points from these axes with a smooth curve then visualize the exponential relationship of the given data.
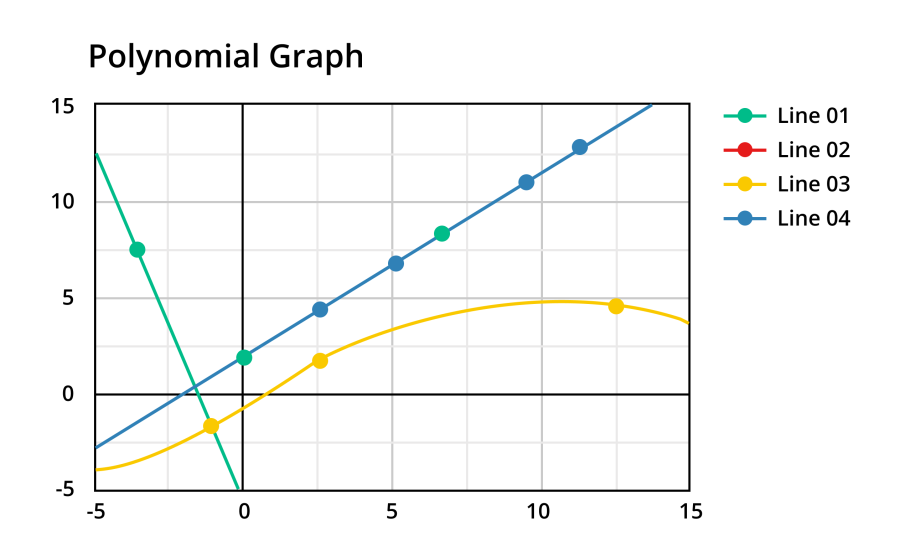
What is a Polynomial Graph?
A polynomial graph shows the behavior of variables on a coordinate plane by the scattering of the graph. By connecting the points of the x-axis and y-axis with a smooth curve, visualize the polynomial curves in the graph using the following data.
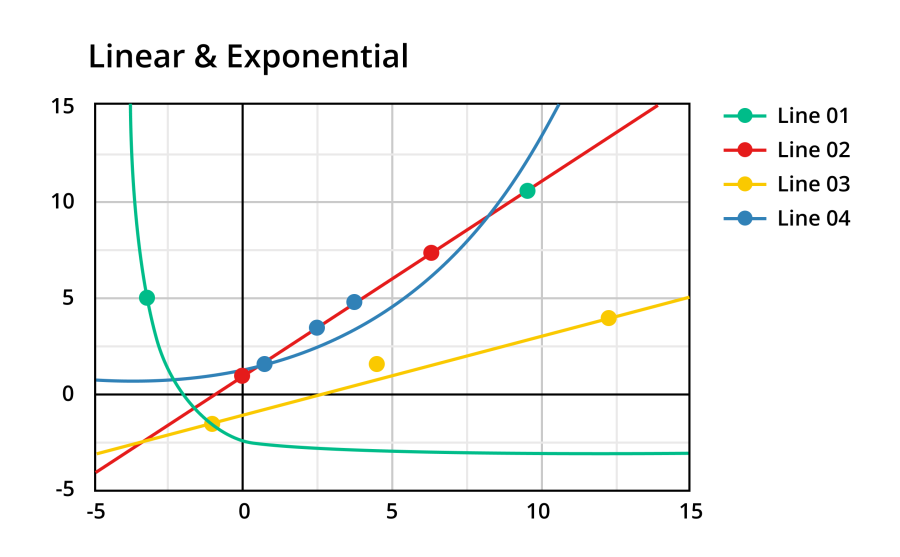
What is Linear and Exponential Graph?
A linear graph shows a linear relationship between point values of the x-axis or y-axis and draws a linear line on the graph. An exponential graph shows an exponential relationship between two variables. It is created by plotting a set of coordinate points on a two-dimensional plane typically with an x-axis and a y-axis.
By connecting the points from these axes with a smooth curve then visualize the exponential and linear relationship of the given data.