
To calculate result you have to disable your ad blocker first.
Grid lines are essential to the formation of geometric shapes and graphical representations in mathematics. Grid lines, often called coordinate grids or Cartesian grids, present graphing points, functions, and data in a visual framework.
Understanding the significance of grid lines is crucial for effectively graphing equations and analyzing various mathematical concepts. Grid lines are a fundamental element of mathematics and are important techniques for charting, data visualization, and problem-solving.
In this article, we'll explore the definition, types, and role of grid lines in graphing. We will also explore the examples of grid lines.
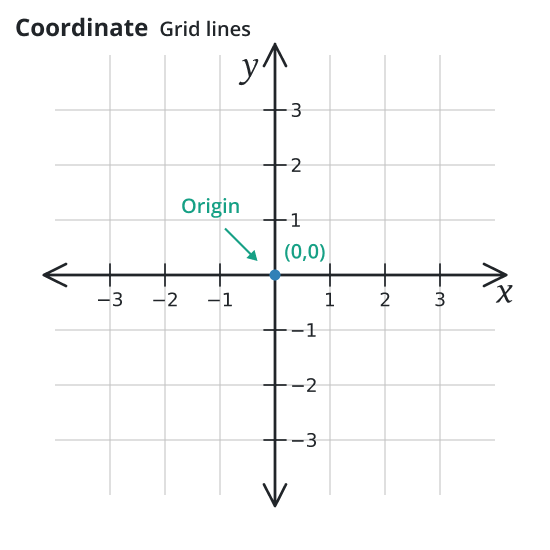
Grid lines consist of two sets of equally spaced, parallel lines forming a two-dimensional plane. A network of squares or rectangles is formed when these lines bisect at an angle of 90o. A distinct set of coordinates (x, y) is given to each intersecting point on the grid to indicate its location with respect to the origin.
Grid lines also referred to as coordinate grids are a network of squares or rectangles made up of equally spaced horizontal and vertical lines. These lines intersect at specific points, forming a grid system.
Grid lines provide a visual framework for accurately plotting points and functions on a graph. They aid in understanding the relationships between variables and interpreting data with precision.
There are different types of grid lines used in mathematics depending on the complexity of the graph or data being represented such as:
Each type serves specific purposes and aids in solving diverse mathematical problems. These commonly used grid types are described below:
Major Grid lines define the axes and subdivide the graph or chart. They are generally prominent, and thicker, and span the entire length or height of the plot. Major grid lines often represent significant intervals or values on the axes, elaborating on detailed clarification.
Minor grid lines are secondary and provide additional subdivisions between major grid lines. They help in achieving a precise level of accuracy while analyzing data. These are typically thinner and lighter in presence compared to major lines.
A Cartesian plane establishes a one-to-one correspondence between the set of ordered pairs
R x R = {(x, y) / x, y Є R}
and the points of the Cartesian plane. In the cartesian plane, two mutually perpendicular are drawn that are known as the coordinate axis. The point of the intersection of these perpendicular lines is called the origin.
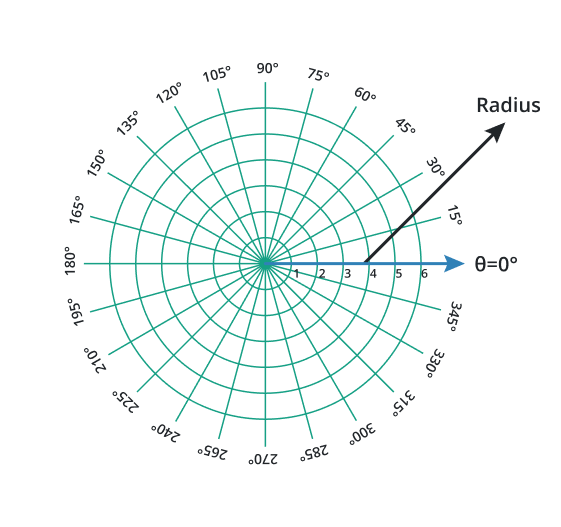
Polar coordinate grid lines present the points in a circular or angular system. An angle and the distance (radius) from a central point locate the position of a point in the polar coordinate system.
The polar angle is the angle that is measured from a reference line and usually the positive x-axis to the line that connects the point and the center of the circle. Grid lines in polar coordinates are circles with their centers at the origin. These circles represent different values of the radius. The angle is measured in degrees or radians, and the grid lines help locate specific points easily.
The mathematical relations for the conversion of cartesian coordinates into polar coordinates are:
r = √(x² + y²)
θ = arctan(y/x)
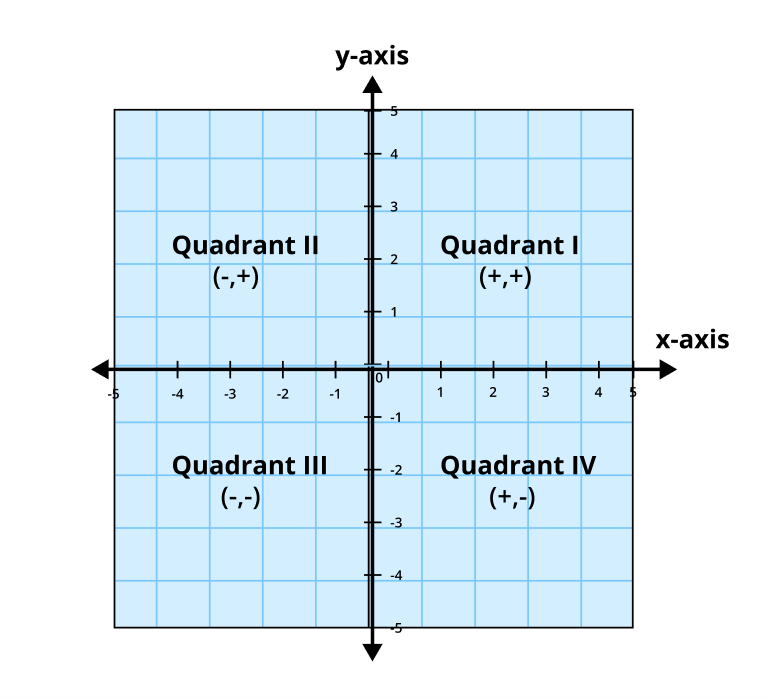
The Cartesian coordinate system, a foundation for graphing with grid lines, was introduced by René Descartes. It enables plotting points, functions, and curves with precision. This system is fundamental for graphing equations, functions, and points.
In-plane, the x-coordinates of points are observed horizontally and y-coordinates vertically or along the y-axis.
Grid lines enable us to plot points accurately on a graph. These points can represent various data, such as population growth, temperature changes, or stock market trends.
When plotting functions, grid lines provide a guide for visualizing how different mathematical expressions behave concerning their input values. They assist in identifying key features such as intercepts, maxima, and minima. Grid-based graphing is extensively used in algebra, calculus, and other mathematical disciplines.
Grid-based graphs are often used to analyze data sets, such as plotting population growth over time or tracking changes in temperature.
Example 1:
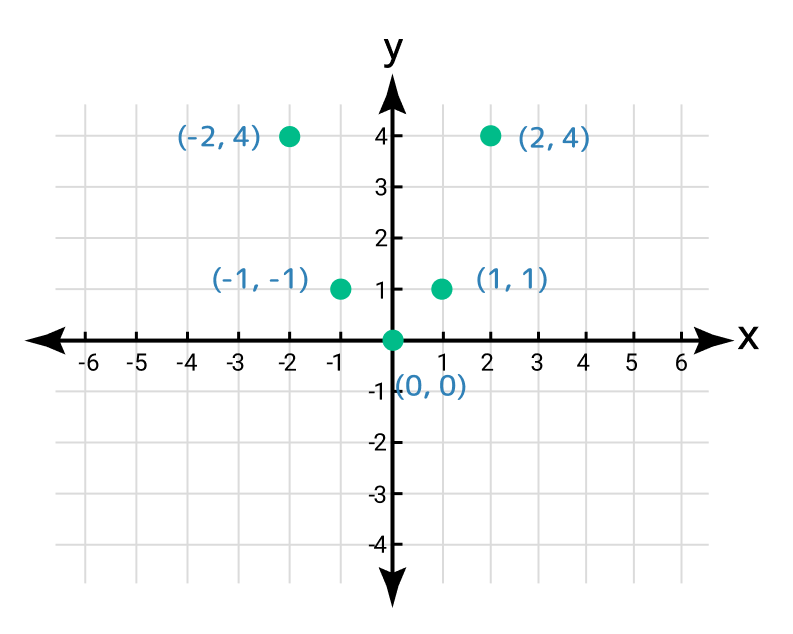
For the quadratic function y = x2, graph it on a Cartesian grid reveals a parabola with its vertex at the origin.
Solution:
Step 1: Given data
Quadratic function: y = x2
Step 2: Write the values of y for different values of x.
x | -2 | -1 | 0 | 1 | 2 |
y = f(x) | 4 | 1 | 0 | 1 | 4 |
(x, y) | (-2, 4) | (-1, 1) | (0, 0) | (1, 1) | (2, 4) |
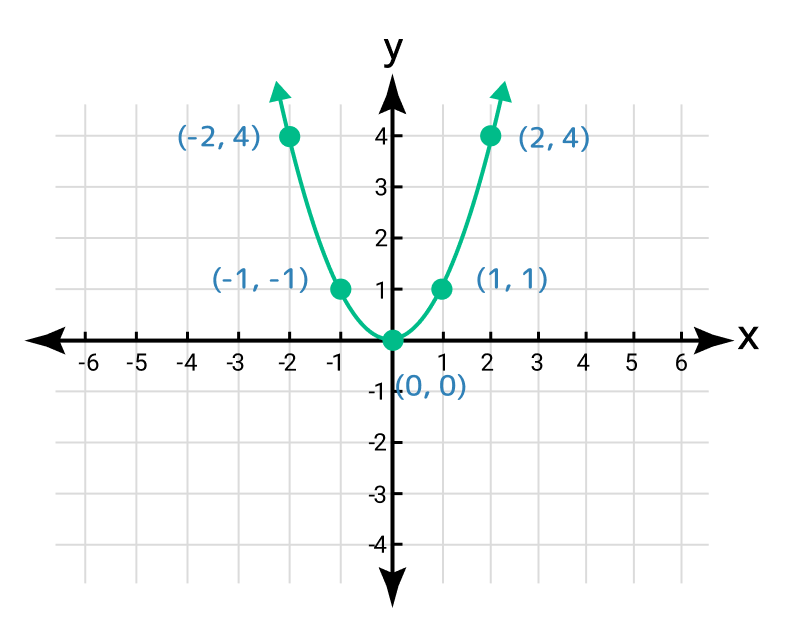
Step 3: Locate these points on the cartesian grid.
Step 4: Join these points. It reveals a parabola with its vertex at the origin.
Example 2:
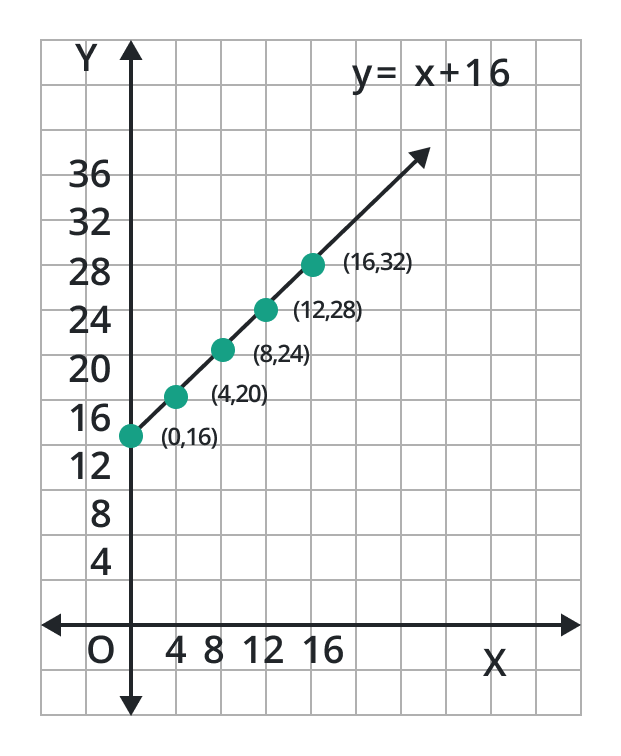
Equation y = x + 16 shows the relationship between the ages of two persons. If the age of one person is x, then the age of the other person is y. Draw the graph.
Solution:
Step 1: Given information:
Equation: y = x + 16
Step 2: We know that y = x + 16 Table of points for the equation is given as:
x | 0 | 4 | 8 | 12 | 16 | … |
y | 16 | 20 | 24 | 28 | 32 | … |
(x, y) | (0, 16) | (4, 20) | (8, 24) | (12, 28) | (16, 32) | … |
Step 3: Locate these points on the cartesian grid lines:
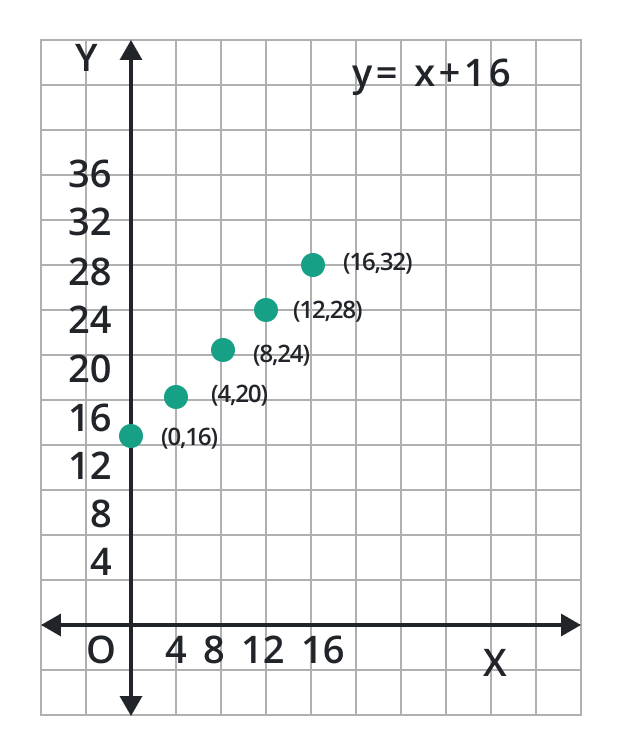
Step 4: Joining these points reveals a straight line.
Example 3:
What will be the polar coordinates if x = 12 and y = 14?
Solution:
Step 1: Given Data:
x = 12, y = 14
Required Data:
r =? and θ =?
Step 2: Find r and θ:
The formula for r:
r = √ ( x2 + y2 )
Now put values in the above formula:
r = √ ( 122 + 142 )
r = √ 144 + 196
r = √ 340
r = 18.4391
The formula for θ:
θ = arctan (y/x)
Now put values in the above formula:
θ = arctan (1412)
θ = arctan (1.1667)
θ = 0.8622 rad
θ = 49.3987 deg
To calculate result you have to disable your ad blocker first.