
To calculate result you have to disable your ad blocker first.
Mathematics is a basic subject that plays an important role in several fields like engineering, economics, finance, etc. The coordinate plane which is also known as the x and y grid is a way commonly used in mathematics to plot points and display data. It is referred to as the math grid.
The grid is a core dimensional concept that is used in the study of mathematical and statistical analysis. It provides a precise description to arrange and present data values, data patterns, and their relationships to one another.
In this article, we’ll discuss the concept of a math grid along with its components, types, and examples.
A grid is a 2D structure comprised of horizontal and vertical lines that intersect each other. It forms a pattern of squares or rectangles, creating a framework that facilitates various mathematical operations and visual representations.
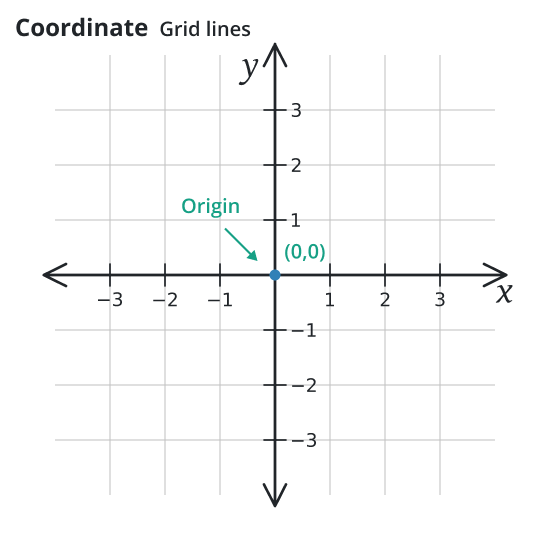
The math grid consists of the x-axis and y-axis. The horizontal line is the x-axis whereas the vertical line is the y-axis. Each increment for the x-axis and y-axis can be any amount that best suits the display of the data.
Commonly, a math grid is used to plot points, as well as to display linear and nonlinear equations. Typically, working with math grids is done using graph paper. The y-axis and x-axis make up the math grid.
The origin of the grid is the point where these two perpendicular axes intersect. The origin is the name given to the location on the grid where both x and y have values equal to zero.
Math grids provide a structured framework for organizing and manipulating data, making them invaluable in various mathematical disciplines. These cells serve as containers for elements such as text, images, or data, enabling a systematic and orderly arrangement. Grids can be physical or conceptual, depending on the context in which they are applied.
In web design, grid systems provide a structure for arranging and lining up content on web pages. They simplify the process of creating responsive layouts and enable designers to achieve consistent designs across multiple devices.
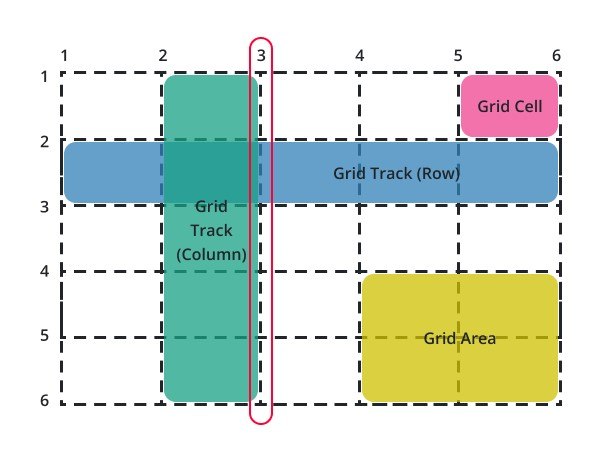
A grid consists of several key components that contribute to its functionality and structure. To better comprehend math grids, it is essential to understand these key components:
In a math grid, rows are the horizontal lines that are parallel to the x-axis. They divide the grid into horizontal rows, offering a reference for the y-coordinate. They provide a reference for data organization and enable comparisons across different entities or periods.
In a math grid, columns are the vertical lines that are parallel to the y-axis. They hold specific data categories or variables, allowing for easy analysis and comparison. They provide a consistent framework for aligning and positioning elements.
Cells are the individual units within the grid formed by the intersections of rows and columns. They contain data values and serve as data points for calculations, visualization, and analysis.
Axis labels are used to denote the categories or variables represented by each column or row. They provide context and help interpret the data within the math grid accurately.
Grids can take on different forms and structures based on their purpose, properties, characteristics, and applications. Here are some common types of grids used in mathematics:
Coordinate grid is another name for the Cartesian grid. It is the most widely used type of grid in mathematics. This sort of grid comprises horizontal and vertical lines that bisect each other at an angle of 90o (right angle).
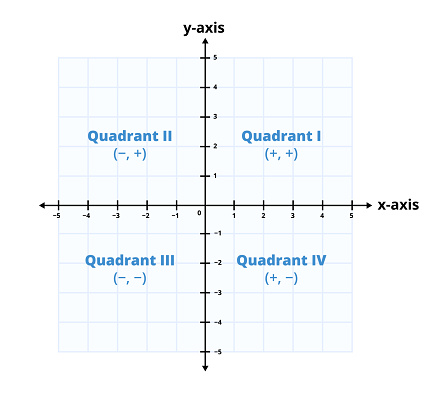
This kind of grid usually is used to coordinate geometry to point out or display different geometric curves, points, shapes, etc.
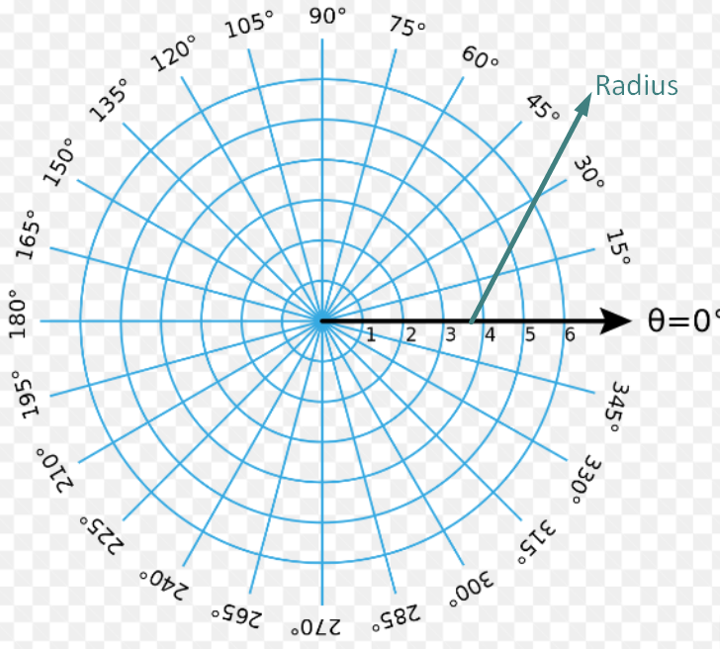
In contrast to the Cartesian grid, the polar grid uses concentric circles and radii to represent coordinates. It is commonly employed in polar coordinate systems to describe points in terms of angles and distances from a fixed origin.
Grids can take on different forms and structures based on their purpose and application.
Math grids can be created using various tools, both traditional and digital. While pen and paper suffice for simple grids, computer software, such as spreadsheet applications or specialized math software, offers enhanced functionality, flexibility, and ease of use.
Visualization is a crucial aspect of math grids, enabling data analysts and mathematicians to comprehend complex information quickly. Graphical representations, such as charts, graphs, and diagrams, can be generated from math grids to visualize trends, relationships, and patterns within the data.
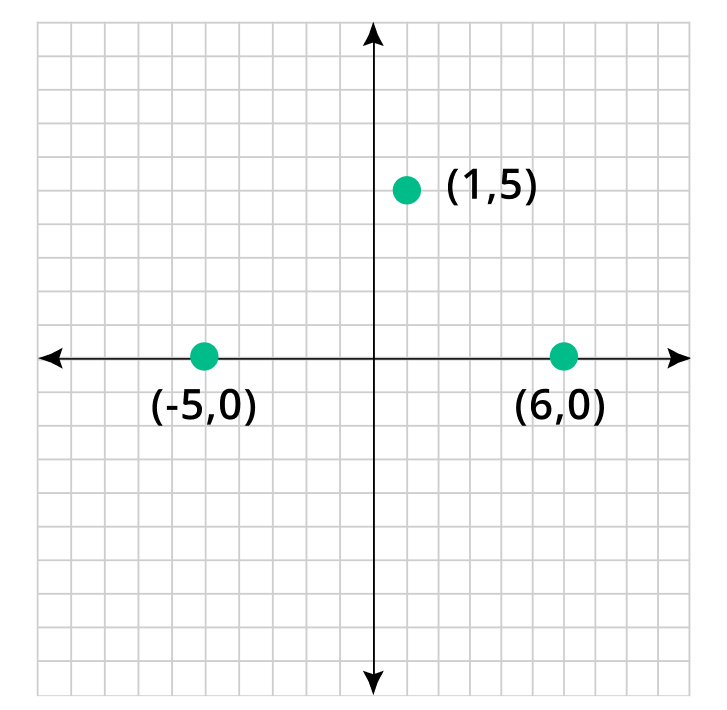
Example 1:
The coordinates of a triangle are A(1, 5), B(-5, 0) and C(6, 0). Graph these coordinates and construct the triangle.
Solution:
Step 1: Given data,
A(1, 5), B(-5, 0) and C(6, 0)
Step 2: Graph each coordinate on the grid.
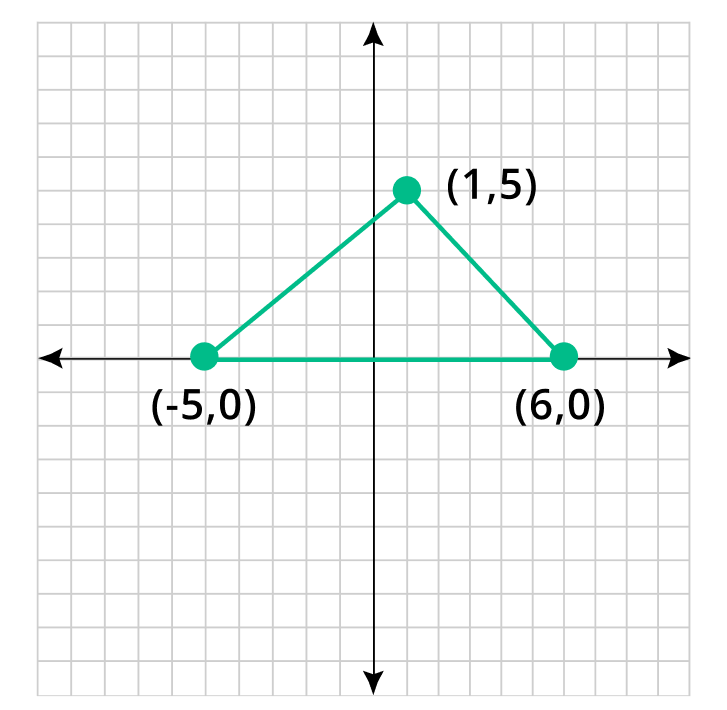
Step 3: Using line segments join these points.
Example 2:
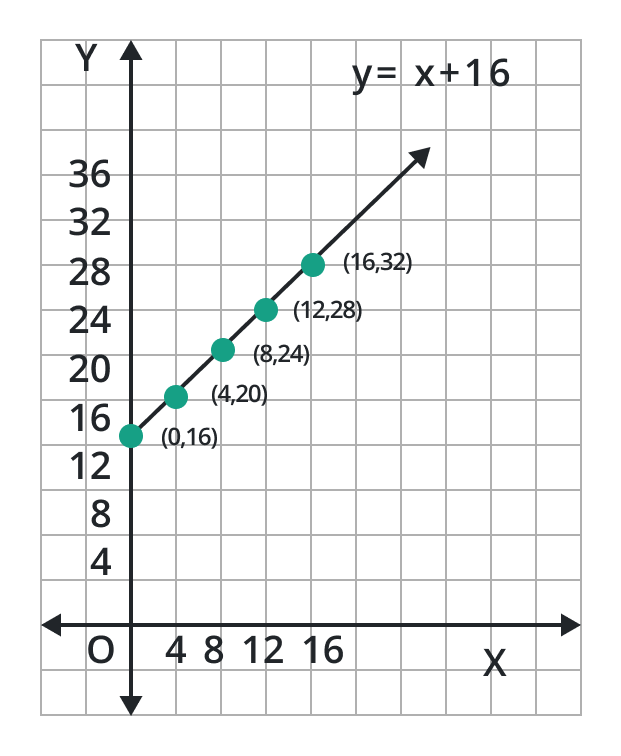
The relationship between two people's ages is expressed by the equation y = x + 16.
If one person is y years old and the other is x years old. Make a graph.
Solution:
Step 1: Given data:
Equation: y = x + 16
Step 2: The values of y coordinate for different values of x are:
x | 0 | 4 | 8 | 12 | 16 | … |
y | 16 | 20 | 24 | 28 | 32 | … |
(x, y) | (0, 16) | (4, 20) | (8, 24) | (12, 28) | (16, 32) | … |
Step 3: Locate these points on the Cartesian grid lines:
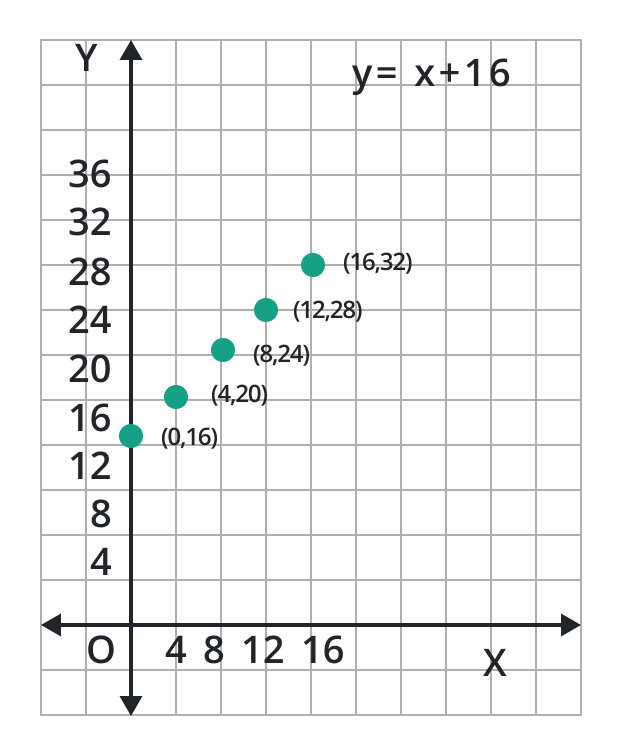
Step 4: We get a straight line by joining these points.
Let us address a few examples of grids that demonstrate the practical application of grids:
Example: Newspaper Layout
Newspapers utilize grids to organize articles, headlines, images, and advertisements. Columns and rows help create a consistent structure, making it easier for readers to navigate the content.
Example: Web Design
Websites often employ grid-based layouts to arrange content sections, menus, images, and other interactive elements. Designs that are responsive to varying screen sizes are made possible by grids.
Example: City Street Layouts
Cities like New York and Barcelona feature grid-based street layouts, where streets intersect at right angles. This design simplifies navigation and enables efficient transportation flow.
To calculate result you have to disable your ad blocker first.